Over time, choosing the right cells defines whether your battery system delivers on expectations or creates hazards; you must weigh chemistry, form factor, and manufacturing quality to achieve consistent performance and reliability, meet application-specific power and energy needs, and avoid safety risks like thermal runaway. Proper selection also unlocks longer lifespan and higher energy density, reduces system complexity, and controls total cost of ownership so your design meets performance, safety, and regulatory goals.
Types of Battery Cells
When comparing chemistries for your pack, you need to match the cell’s electrical characteristics to the system’s duty cycle: peak power, average load, expected lifetime, and environmental constraints. In practice, that means evaluating trade-offs between energy density, cycle life, charge acceptance, and thermal stability for each chemistry and selecting cells that satisfy your voltage, capacity, and safety budget.
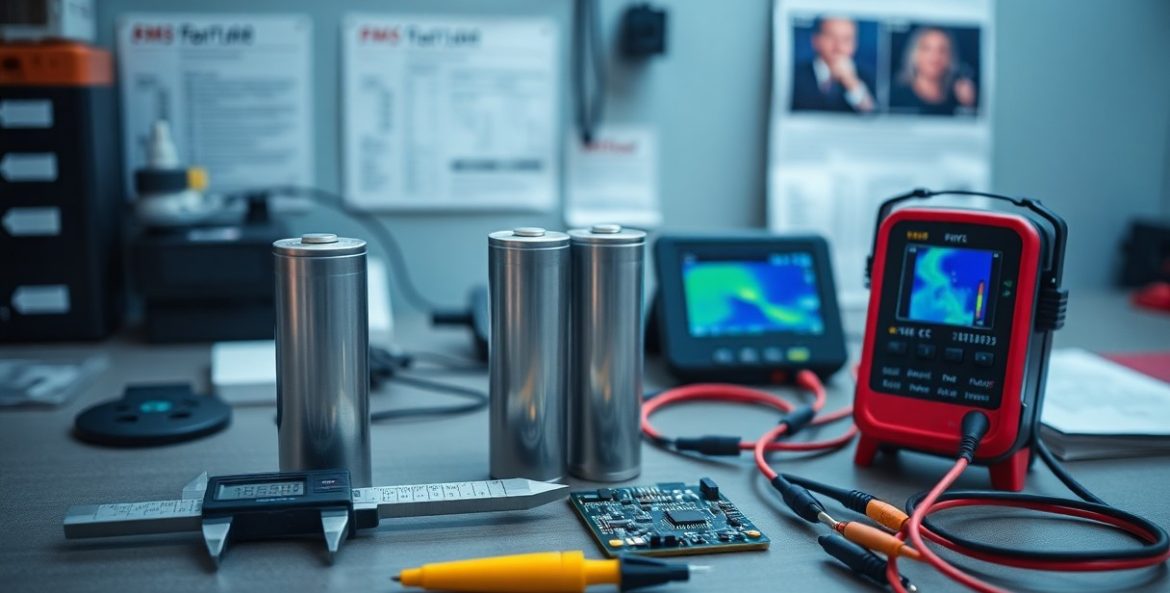
Beyond headline specs, you should inspect real-world performance data: discharge curves at typical C-rates (0.2C-2C), calendar aging at 25-45°C, and failure modes under overcharge or mechanical abuse. Use cell-level test results (e.g., capacity retention after 1000 cycles, internal resistance growth in milliohms) to size your BMS, thermal management, and protection margins.
| Cell Type | Key Characteristic |
|---|---|
| Lithium‑Ion | High energy density (150-260 Wh/kg typical), requires active BMS and thermal mitigation |
| Lead‑Acid | Low cost, low energy density (30-50 Wh/kg), good surge capability, needs ventilation |
| Nickel‑Metal Hydride | Moderate energy density (60-120 Wh/kg), good cycle robustness, higher self‑discharge |
| Flow / Other | Scalable energy capacity, often used for stationary storage where weight is secondary |
- energy density
- cycle life
- thermal runaway
- charge acceptance
Lithium-Ion Cells
In your designs, lithium‑ion cells dominate when you need a high energy-to-weight ratio: NMC and NCA chemistries commonly deliver ~200-260 Wh/kg, while LFP variants typically sit around 90-160 Wh/kg but offer much better thermal stability and longer cycle life (often >2000 cycles at 80% depth of discharge). You should size pack voltage and parallel strings to keep individual cell C-rates within manufacturer limits – many automotive cells tolerate 1C-3C continuous, while specialty high-power cells handle 5C+ for short bursts.
Thermal management is non-negotiable: cell internal resistance rise accelerates above 40°C and the probability of thermal runaway increases with overcharge, physical damage, or high-rate abuse. You must implement cell-level balancing, robust BMS algorithms (including SOC/SOH estimation), and passive or active cooling to maintain safe operation across your operating envelope.
Lead-Acid Cells
You’ll select lead‑acid when cost per kWh and availability matter more than energy density – typical flooded or AGM cells supply ~30-50 Wh/kg and excel at delivering high inrush currents for starter or backup applications. Cycle life depends strongly on depth of discharge: keeping DOD below 30% often yields several hundred to a thousand cycles, while deep-cycle lead‑acid variants provide 200-600 cycles at 50% DOD.
Charging behavior is different from lithium: float and equalization are part of long-term maintenance, and you must provide ventilation since charging emits hydrogen gas; failure to do so creates an explosion risk in confined spaces. You should also guard against sulfation by avoiding prolonged low-state-of-charge storage and by using proper charge profiles.
AGM and gel variants reduce maintenance and spillage risk but trade some cycle life and charge acceptance; in stationary UPS systems you commonly see >95% recyclability for lead‑acid cells, which can be a decisive sustainability and cost factor. Perceiving the maintenance, ventilation, and recycling implications early will guide whether lead‑acid fits your application.
Nickel-Metal Hydride Cells
When weight is less critical than robustness and low-temperature performance, NiMH can be attractive: you can expect ~60-120 Wh/kg depending on cell construction, with good tolerance to charge/discharge rates and fewer thermal runaway concerns compared with lithium. You should note the high self‑discharge (often ~10-30%/month at 20°C) and plan periodic refresh charging if the pack sees infrequent use.
Automotive hybrid systems (for example, early Prius packs) demonstrate NiMH’s strength in high cycle-count, high‑power regenerative applications, regularly achieving 500-1000 cycles in real-world duty. You must design for moderate C-rates (commonly 0.5C-2C continuous) and monitor temperature, since life declines rapidly above ~40°C.
Recycling and material cost (rare earths in some formulations) impact lifecycle economics, and you should validate supplier data on cycle retention and internal resistance growth before committing to NiMH for your product. Perceiving the balance between durability, self-discharge, and end-of-life handling will determine if NiMH meets your system goals.
Factors Influencing Cell Selection
- Energy density
- Cycle life
- Power density
- Safety
- Cost
- Thermal management
- Calendar life
Application Requirements
Your system’s duty cycle and packaging constraints determine which cell chemistries will perform. For example, if you design an EV pack targeting >400 km range on a 75 kWh battery, you will favor cells with high energy density (200-260 Wh/kg for modern NMC/NCA) to reduce pack mass and volume; conversely, for an industrial UPS where runtime and long shelf life matter more, you might pick cells with higher cycle life and lower self-discharge even at the expense of density.
When you size for power rather than energy, steady high C-rate capability and low internal resistance become dominant metrics; a 3C continuous discharge requirement rules out many high-energy prismatic cells and pushes you toward pouch or cylindrical formats optimized for power density. Thermal envelope, certification needs (UL, IEC), and form-factor integration are equally important because they affect your pack-level cooling design and safety strategy.
Energy Density
When you prioritize energy density, quantify it at both cell and pack levels: cells may advertise 220 Wh/kg, but once you add BMS, cooling, and mechanical structure the pack number often drops 20-30%. In EV examples, swapping from LFP (~90-160 Wh/kg) to NMC/NCA (~200-260 Wh/kg) can reduce pack mass by 15-25% for the same usable capacity, directly impacting vehicle range and efficiency.
Also evaluate volumetric density (Wh/L) if packaging is constrained; aerospace and portable power systems frequently optimize for Wh/L over Wh/kg. Cells with higher nominal voltages can reduce series cell count and BMS complexity, but you must check compatibility with your converter/inverter architecture and cell balancing strategy.
More detailed trade-offs include long-term fade: some high-energy cells sacrifice cycle life-for instance, a high-Ni NMC may start at 250 Wh/kg but lose capacity faster under fast-charging regimes, so you should test energy retention at realistic temperatures and 1C-3C cycles to validate the advertised numbers.
Cycle Life
Your expected mission profile-depth-of-discharge (DoD), charge/discharge rates, and calendar time-directly shapes the required cycle life. For grid-tied storage cycling daily, you might need >5,000 cycles at 80% DoD (LFP commonly achieves 3,000-7,000 cycles depending on conditions), whereas consumer electronics often accept 300-1,000 cycles if replacement is feasible and cost is low.
Testing should replicate real use: accelerated cycle tests at elevated temperature (e.g., 45°C) and high DoD reveal degradation modes that room-temperature, low-DoD tests miss. You should include metrics like capacity retention after X cycles and impedance growth, since increased internal resistance affects usable power even before capacity numbers fall.
More information: cycle-life gains in chemistry selection can translate to lifecycle cost savings-if an LFP cell costing 20% more upfront provides 3× the cycles compared with an NMC alternative, your levelized cost per delivered kWh can drop substantially, which you must model against your replacement logistics and warranty exposures.
Assume that you weight these characteristics against cost, manufacturability, and safety to create a selection matrix tailored to your product goals.
Tips for Selecting the Right Cell
Prioritize how the cell will behave over the life of your product: match energy density and power density to peak and average loads, set minimum cycle life and calendar life targets (e.g., 2,000 cycles at 80% DoD for a consumer EV or >5,000 cycles for grid storage), and require explicit safety validation such as UN38.3, IEC 62660, or UL 1642 test reports. Use the following tactical checklist when comparing candidates:
- Check energy density (Wh/kg) – pouch NMC: ~200-260 Wh/kg; LFP: ~90-160 Wh/kg.
- Verify cycle life at defined DoD – LFP often >3,000 cycles; high-Ni NMC may be 1,000-2,000 cycles.
- Confirm power density and continuous/discharge C-rate – 4C-10C for power cells, 1C-3C for energy cells.
- Require documented safety performance and abuse tolerance (short, overcharge, nail, thermal) and vendor traceability.
- Compare total cost metrics: $/Wh or $/kWh at cell level and projected $/kWh at pack level.
After you screen by those criteria, quantify trade-offs with a simple matrix (e.g., energy vs. cycle vs. cost) and run a worst-case thermal simulation on the top 3 candidates before committing to a production pilot.
Performance Metrics
Focus first on the measurable numbers that will determine system behavior: specify C-rate requirements (peak and continuous), allowable internal resistance rise over life, and acceptable state-of-charge (SoC) window. For example, if your application requires 2,000 W continuous from a 10 kWh pack, you can calculate the necessary per-cell power density and rule out low-power chemistries without running late-stage prototypes.
Also set objective durability targets: mandate cycle-count tests at your intended Depth of Discharge (DoD) and temperature range (e.g., 1,500 cycles at 80% DoD and 25-45°C), and require capacity retention curves at intervals (0, 250, 500, 1,000 cycles). Insist on measured impedance growth data – a projected internal resistance increase of >50% over 1,000 cycles is often a deal-breaker for high-power systems.
Manufacturer Reputation
Pick suppliers with demonstrable production quality: look for ISO 9001 or IATF 16949 certification, published failure rates, and long-term customer references in similar applications (e.g., EV, ESS, or aerospace). Global names like Panasonic, LG Energy Solution, Samsung SDI, CATL, and BYD can be benchmarks because they offer traceability, high-volume testing, and consistent specifications across batches.
Demand transparency on cell sourcing and test data – ask for sample lots with serial-level logs, batch test reports, and accelerated aging data. If you need automotive-grade performance, require evidence of homologation testing and supplier audits; a supplier that can produce UL listings and independent lab validation reduces integration risk.
Also evaluate their after-sales support: confirm warranty terms (years and cycles), RMA turnaround times, and spare-cell availability – shorter lead times and handover documentation are often more valuable than a marginally lower unit price.
Cost Considerations
Assess cost on a total-cost-of-ownership basis rather than just cell sticker price: calculate $/kWh at pack level including thermal management, BMS complexity, and expected replacement frequency. As a rule of thumb, cell-level cost commonly ranges from about $0.05-$0.20 per Wh ($50-$200 per kWh) depending on chemistry and form factor, with LFP typically at the lower end and high-Ni NMC at the higher end.
Balance upfront cost against lifecycle expense: for instance, an LFP cell that costs 10-20% less but provides 2-3× the cycle life can yield lower $/cycle and lower total maintenance for grid storage. Conversely, if your product needs maximum range in limited volume (an EV sports application), paying 20-40% more for higher energy density NMC may be justified.
Factor in non-recurring costs – qualification testing, thermal design changes, and supplier audits – when comparing quotes; cheaper cells often require more engineering spend to meet safety and integration targets, which can erase apparent savings.
Recognizing which specific trade-offs (energy, power, lifespan, safety, and cost) you can accept will let you narrow to the best cell candidate and avoid costly redesigns later.
Step-by-Step Cell Selection Process
Selection Workflow Summary
|
Phase |
Actions & Details |
|---|---|
|
Defining Application Needs |
Specify nominal pack voltage, usable capacity (Ah), peak and continuous power, expected duty cycle (e.g., 80% DOD daily vs 20% occasional), environmental range (typically -20°C to +60°C for many systems), and safety targets (UL/IEC/UN tests required). |
|
Researching Options |
Compare chemistries (LFP, NMC, NCA, high-nickel variants) by energy density (150-260 Wh/kg for mainstream Li-ion), cycle life (LFP often 2,000-5,000 cycles), C-rate capability (1C, 3C, 10C), internal resistance (mΩ range), cost per cell and supply-chain risk. |
|
Shortlisting & Simulation |
Run pack simulations: thermal model, voltage sag under load, SOC swing, and range/runtime estimates. Use worst-case scenarios (high ambient, high discharge) and target cell imbalance metrics (±2% capacity variance for best results). |
|
Testing and Validation |
Prototype with 3-10 sample cells from multiple lots/vendors. Perform capacity at 0.2C, power pulses at 1-5C, cycle life at expected DOD and temperature, and abuse tests (overcharge, short, nail penetration) per standards (UL 1642, UN38.3, IEC 62660 where applicable). |
|
Final Selection & Procurement |
Factor cost per kWh, MOQ, lead times, and qualification test results. Lock in vendor agreements with lot traceability and initial acceptance testing criteria. |
Defining Application Needs
Start by quantifying the electrical and mechanical envelope: the continuous current, peak pulses (for example, a 2 kW motor on a 48 V pack implies ~42 A peak), expected cycle frequency, target calendar life in years, and maximum allowable pack temperature. You should translate system-level requirements into per-cell targets – for instance, if your pack is 48 V and 20 Ah, a cell with 3.6 V nominal and 10 Ah requires a 4s2p topology; that immediately constrains allowable cell capacity and form factor.
Next, identify safety and regulatory constraints tied to the application: if the product will ship internationally or enter consumer markets, plan for UN38.3 shipping tests, UL/IEC compliance, and potential automotive-grade requirements. Also weigh environmental extremes – cells that perform well at +60°C may age faster, so you must decide whether longevity (e.g., >2,000 cycles) or raw energy density (e.g., >220 Wh/kg) is the priority for your use case.
Researching Options
Begin by gathering datasheets and vendor test reports, and compare chemistry trade-offs: LFP typically offers lower energy density (~90-160 Wh/kg) but far greater cycle life and thermal stability, while NMC/NCA can reach 200-260 Wh/kg with higher energy but increased thermal runaway risk at elevated SOC and temperature. Pay attention to rated C-rates – if your duty cycle requires sustained 3C discharge, exclude cells rated only at 0.5-1C or you will see excessive voltage sag and heating.
Evaluate supplier maturity and supply-chain resilience: check lead time variability, MOQ, and available cell traceability. You should also request actual sample cells from at least two suppliers and review their batch test data; compare internal resistance (mΩ), capacity spread, and recommended charge/discharge voltages to ensure compatibility with your BMS and charge architecture.
More detail-oriented vetting will include cross-checking independent test data and case studies: for example, in medium-duty e-scooters some manufacturers switched from high-nickel NMC to LFP after field failures in hot climates, trading ~15-30% energy density for a substantial drop in thermal incidents and a doubling of cycle life under 40°C operation.
Testing and Validation
Design your validation plan to reflect real-world stresses: run capacity tests at 0.2C for baseline state-of-health, then perform power-profile tests with bursts at the expected peak C-rate (e.g., 3-5C for 10 s) followed by rest periods to measure recovery and IR. Include calendar life and accelerated aging (e.g., 45°C at 60% SOC) to estimate end-of-life using Arrhenius extrapolation; many teams observe roughly a 2× degradation rate per +10°C increase in storage temperature, so thermal control strategy dramatically affects lifetime.
Perform safety and abuse testing to the standards your product requires – nail penetration, external short, overcharge to 4.5-4.6 V (depending on chemistry), and crush tests if mechanical hazards exist. For statistically meaningful conclusions, test multiple samples (commonly 6-10 cells per condition) and track variance; a single failing cell can indicate a manufacturing or lot-quality issue that invalidates a supplier choice.
More focused validation should include pack-level thermal propagation tests and BMS fault injections: verify that a single-cell failure does not cascade, confirm balancing behavior after repeated high-current cycles, and ensure your thermal design keeps maximum cell temperature below the threshold where degradation accelerates – typically ~60°C continuous and well below the ~150-200°C range associated with thermal runaway initiation.
Pros and Cons of Different Cell Types
To evaluate trade-offs quickly, you should map each chemistry’s strengths and weaknesses to your application’s priorities – for instance, whether energy density, cycle life, or safety dominates your specification. By looking at concrete metrics (Wh/kg, cycles at a given DoD, thermal runaway propensity, cost per kWh), you can avoid selections that force expensive compromises at the pack level.
When you weight those metrics side-by-side, patterns emerge: some chemistries give you high range but require advanced BMS and thermal controls, while others deliver long calendar and cycle life with lower system cost but sacrifice volumetric efficiency. Use these comparisons to assign measurable tolerances (e.g., minimum 150 Wh/kg, >1,000 cycles at 80% DoD) before you finalize a cell family.
Pros and Cons by Cell Type
| Lithium‑ion (NMC / NCA) | Pros: High energy density (~150-260 Wh/kg), high power density and fast charge capability; Cons: Thermal runaway risk if abused, requires robust BMS and cooling; supply-chain cost and cobalt content considerations. |
| LFP (LiFePO4) | Pros: Excellent thermal stability and safety, long cycle life (>3,000 cycles in many cell formats), lower material cost (no cobalt); Cons: Lower energy density (~90-160 Wh/kg), larger pack volume and weight for the same capacity. |
| Lead‑Acid (VRLA / Flooded) | Pros: Low upfront cost, robust for high cranking/ surge applications, very mature recycling infrastructure; Cons: Very low energy density (~30-50 Wh/kg), limited cycle life (<500 cycles at deep DoD), toxic lead and corrosive electrolyte. |
| NiMH | Pros: Moderate energy density (~60-120 Wh/kg), tolerates abuse and overcharge better than some chemistries; Cons: High self‑discharge, heavier than Li‑ion, fewer form factors and lower energy than modern Li‑ion. |
| Solid‑State (emerging) | Pros: Potential for >300 Wh/kg and improved intrinsic safety (non‑flammable electrolyte); Cons: Immature manufacturing scale, high cost today, and uncertain real‑world cycle/calendar life until proven at scale. |
Advantages of Lithium-Ion
When you pick lithium‑ion, you get the best balance of energy and power for space‑ or weight‑sensitive systems: typical cell energy densities range from 150-260 Wh/kg for NMC/NCA cells, enabling longer electric vehicle range or lighter portable equipment. Many commercially available Li‑ion cells achieve 1,000-2,000 cycles at moderate depth of discharge with proper thermal management and a quality BMS, which translates into lower lifecycle cost per kWh in high‑use applications.
For performance systems you design, Li‑ion also offers superior charge efficiency (>90% round‑trip) and high C‑rate capability for fast recharging and high transient power demands. You should still budget for a comprehensive BMS and engineered cooling: those system components are what let you exploit the chemistry’s strengths safely and reliably.
Disadvantages of Lead-Acid
If you consider lead‑acid, expect to trade form‑factor and cycle endurance for low upfront price: energy density is typically 30-50 Wh/kg, so your pack will be substantially heavier and larger than a Li‑ion equivalent. Cycle life is limited – often 200-500 cycles at realistic depths of discharge – and repeated deep cycling accelerates sulfation and capacity loss, which quickly raises your total cost of ownership.
Operationally, lead‑acid cells have poor charge acceptance once partially discharged and are sensitive to temperature and state‑of‑charge management; flooded designs require ventilation and periodic maintenance, while sealed VRLA cells are more convenient but still suffer from shorter useful life under deep cycling. For backup or starter applications this can be acceptable, but for daily deep‑cycle duty you will replace banks frequently.
More specifically, although recycling rates for lead‑acid are high (>95% in many regions), you must handle hazardous lead and sulfuric acid in manufacturing, transport, and end‑of‑life processes; regulatory and environmental controls add logistic and compliance costs. In practice, you should cap usable DoD to 20-30% for long service life, and plan for frequent equalization, ventilation, and replacement intervals when sizing systems for cyclic applications.
Common Mistakes in Cell Selection
You often see teams pick cells based on headline numbers-capacity (Ah) or energy density (Wh/kg)-without matching those specs to the real duty cycle, peak C-rate, or end-of-life targets. For example, selecting a cell rated for continuous 1C when your system needs repeated 3C bursts will drive excessive heat, voltage sag, and accelerated ageing within months rather than years. Field failures commonly trace back to that mismatch: increased internal resistance, reduced usable range, and premature warranty returns.
Another frequent error is treating cell data-sheet values as guarantees instead of lab-conditional results; manufacturers test at specific temperatures, SOC windows, and controlled charge/discharge profiles. If you deploy the same cell in a device that routinely sees -20°C nights and +45°C afternoons, or that exposes cells to vibration and partial-state-of-charge operation, expect real-world capacity and life to diverge by 20-50% from datasheet claims. Mitigation requires you to model worst-case scenarios and include appropriate headroom in both capacity and thermal design.
Underestimating Capacity Needs
When you size a pack only to meet average load without accounting for peak loads, inefficiencies, and ageing, usable energy falls short. Calculate energy using realistic consumption numbers-an automotive example: at ~250 Wh/mi, a 200-mile target needs ~50 kWh usable; if you allow only 80% depth-of-discharge and expect 20% fade over life, initial pack energy should be closer to 75 kWh. Failing to include that headroom forces you into conservative operating windows that erode the user experience or requires more frequent cycling, which further shortens calendar and cycle life.
Plan for derating: cells commonly lose 10-30% capacity over the first few years depending on temperature and cycle stress, and high C-rate discharge can reduce effective capacity under load by 5-20%. If you miss these effects during design, you’ll see increased warranty claims and dissatisfied users. Any underestimation of usable capacity will cascade into system-level failures and higher total cost of ownership.
- Usable energy vs nominal
- Depth-of-discharge assumptions
- C-rate under peak load
- Ageing and derating factors
Ignoring Environmental Factors
Temperature extremes and humidity change how a cell behaves: capacity can drop by ~20-30% at -20°C, internal resistance rises, and charge acceptance falls; at sustained 45°C operation, chemical side reactions accelerate and calendar life can shorten by roughly half for every +10°C increase in average cell temperature. You must validate cell selection against the expected ambient range-storage, charge, discharge, and enclosure thermal resistance all matter. For instance, thermal runaway risk increases when elevated temperature coincides with high SOC and high C-rate cycling.
Thermal management isn’t optional; active cooling or heating can maintain the cell between ~15-35°C to optimize both performance and lifetime. In field deployments such as telecom sites in hot deserts or EVs in cold climates, lack of thermal control has produced 20-40% faster capacity fade and measurable increases in maintenance costs. Any neglect of environmental boundary conditions will magnify degradation modes like lithium plating in cold or accelerated SEI growth in heat.
Humidity, altitude, and mechanical stress also influence safety and longevity: condensation can corrode busbars and connectors, low pressure can alter thermal convection, and vibration accelerates connector fatigue and internal particle movement. You should perform environmental qualification tests-thermal cycling, damp-heat, vibration-which often reveal weaknesses that datasheet specs alone do not. Any unchecked environmental exposure will translate into higher failure rates in the field.
- Operating temperature range
- Thermal management requirements
- Humidity and ingress protection
- Vibration and mechanical robustness
To wrap up
Presently you face a chain of design decisions where cell selection sets the boundaries for energy density, cycle life, safety margins, thermal management, and cost. The chemistry, form factor, and performance profile you choose dictate the architecture of your battery management system, the cooling strategy you deploy, and the trade-offs between peak power and longevity that your product will accept.
You should align cell choice to the operational envelope of your application, validate candidates with realistic test protocols, and factor in supply chain reliability and end‑of‑life handling when sizing systems. Careful selection and integration of cells lets you optimize performance, control total cost of ownership, and reduce safety and warranty risks across the product lifecycle.